
To what extent are Polymarket prices well calibrated with eventual event outcomes?
HKU Capstone Project · 2025–2026
A Multi-Framework Analysis of Information Efficiency & Trading Signals in Decentralized Prediction Markets
Can crowd-sourced prediction markets like Polymarket serve as a reliable, real-time alternative to traditional forecasting benchmarks? We put that question to the test — using Polymarket & Kalshi as case studies.
01 · Introduction
What are prediction markets — and why do they matter?
Prediction markets are decentralised platforms where participants trade binary contracts on future events, backing their beliefs with real capital. A contract price in the range [0, 1] can be read directly as the market's consensus probability of an outcome.
These markets have expanded far beyond politics and sports into macroeconomic forecasting (Fed decisions, unemployment, inflation) and corporate events (earnings, IPOs). This raises a compelling question:
Can crowd-sourced prediction markets serve as a reliable alternative to traditional macroeconomic forecasting benchmarks?
To answer it, this project combines data collection, cloud database design, monitoring, and quantitative analysis to evaluate market efficiency and trading signals in a structured, reproducible way.
In Scope
- Polymarket (+ Kalshi for cross-market) data collection
- PostgreSQL cloud storage
- Calibration / information-incorporation / consistency measures
- Category comparison across market types
- Simulated strategy & arbitrage evaluation
Out of Scope
- Real-capital live trading
- Full cross-platform coverage of every venue
- Institutional low-latency optimisation
02 · Research Questions
Five questions guiding the analysis
How rapidly do Polymarket prices respond to relevant public information?
Are there observable pricing inconsistencies within Polymarket or across platforms such as Kalshi?
Do efficiency properties differ across categories (politics, sports, finance/macro, corporate)?
Can these observations support useful predictive or simulated trading strategies?
Three dimensions of "efficiency"
Forecast Calibration
Responsiveness
Internal Consistency
03 · Data & Infrastructure
A cloud-native pipeline built for scale
0
Minute-level records
0
Hourly observations
0
Resolved earnings markets
0
Resolved macro events
Cloud-native database
A PostgreSQL instance deployed on the cloud (Onidel) continuously ingests from Polymarket's Gamma API and CLOB API, alongside Kalshi data captured in a dedicated kalshi_trades store.
Four-level data hierarchy
Data follows a clean containment model: Series → Event → Market → Price history (per outcome token). Each market has two CLOB tokens (Yes / No); the Yes price ≈ the implied probability.
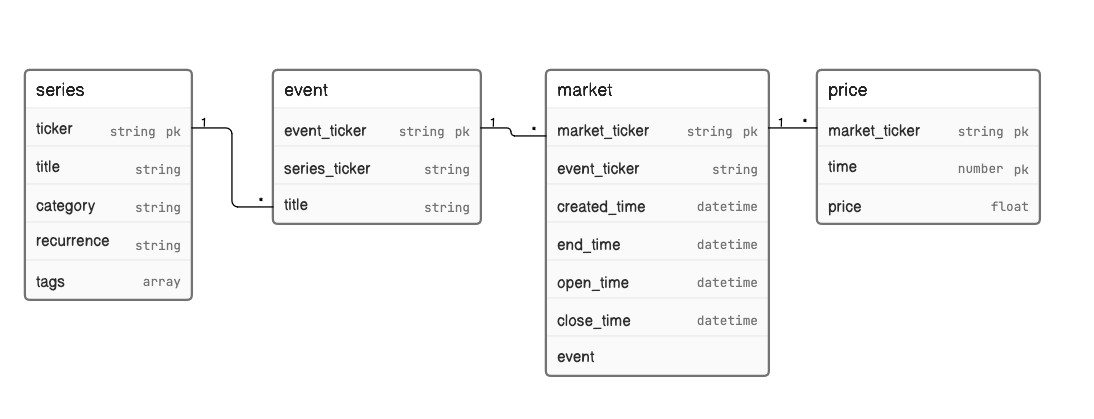
Data dictionary (condensed)
Top-level grouping of related events (recurring themes, leagues, election cycles).
| Column | Type | Description |
|---|---|---|
| ticker | string · PK | Series identifier (primary key). |
| title | string | Human-readable series name. |
| category | string | Domain: macro, corporate, politics, sports. |
| recurrence | string | Recurrence pattern (e.g. weekly, monthly). |
| tags | array | Topic tags for discovery / filtering. |
One real-world question/window under a series (e.g. a scheduled data release).
| Column | Type | Description |
|---|---|---|
| event_ticker | string · PK | Event identifier (primary key). |
| series_ticker | string | Link to parent series.ticker. |
| title | string | Event description / display title. |
Binary outcome contract defined by a verifiable statement; resolves Yes / No.
| Column | Type | Description |
|---|---|---|
| market_ticker | string · PK | Market identifier (primary key). |
| event_ticker | string | Link to parent event.event_ticker. |
| created_time | datetime | When the market was created. |
| open_time | datetime | Trading open time. |
| close_time | datetime | Trading close time. |
| end_time | datetime | Resolution / settlement time. |
Time series of traded prices per market. Yes price ≈ implied probability.
| Column | Type | Description |
|---|---|---|
| market_ticker | string · PK | Link to market.market_ticker (primary key). |
| time | number · PK | Observation timestamp (primary key). |
| price | float | Recorded price in [0, 1]. |
04 · Methodology
From raw prices to rigorous metrics
Forecast construction
Discrete binary bins are converted into a single implied value through probability-weighting:
Implied = Σ(Yes prob × threshold) / Σ(Yes prob)
Evaluation metrics
Accuracy measured with MAE and RMSE across horizons (30d, 14d, 7d, 1d), and Brier score for calibration (0 = perfect, 0.25 = random-at-0.5).
MAE = (1/n) Σ |fᵢ − aᵢ| · RMSE = √[(1/n) Σ (fᵢ − aᵢ)²]
Brier = (1/n) Σ (fᵢ − oᵢ)²
Horizon-aligned panel design
Observations are grouped into aligned windows for fair comparison across markets:
Early · 90–31d
Mid · 30–8d
Pre-resolution · 7d–25h
Resolution · final 24h
Cross-market matching framework core
A four-stage pipeline underpins the latest cross-market work — linking economically-equivalent contracts across Polymarket and Kalshi.
01
Catalog Export
Extract contract catalogs from both venues for comparison.
02
Semantic Matching
Sentence-transformers all-MiniLM-L6-v2, cosine similarity on titles/descriptions.
03
Rule-based Review
Topic-family, date-proximity, contract-family & exclusion filters + human review.
04
Transformation
Map Kalshi thresholds to Polymarket brackets; sum Fed dissent-split contracts.
05 · Findings
What the data revealed
Across five analytical fronts, prediction-market prices proved consistently informative — often beating traditional forecasting benchmarks.
Macro Events — FOMC · Unemployment (U-3) · CPI
Polymarket vs institutional forecasting benchmarks across the macro calendar (35 resolved events: 3 FOMC + 2 U-3 + 30 CPI).
FOMC Brier 0.044 · 82% better than random
U-3 Brier 0.096 · 62% better
CPI Brier 0.107 · 57% better
FOMC vs CME FedWatch
Polymarket consistently outperforms CME FedWatch at all horizons, converging smoothly toward the eventual 3.625% hold (aggregated across the Jan/Mar/Apr 2026 meetings).
| Horizon | PM MAE % | CME MAE % |
|---|---|---|
| 30d | 0.0076 | 0.0104 |
| 14d | 0.0028 | 0.0052 |
| 7d | 0.0013 | 0.0037 |
| 1d | 0.0005 | 0.0023 |
CPI vs Investing.com (final pre-resolution)
Across 16 YoY + 14 MoM releases, Polymarket is broadly level on YoY and better on MoM. A notable curiosity: peak accuracy around the 12-hour mark before release.
| Series | PM MAE | Inv. MAE | Closer |
|---|---|---|---|
| CPI YoY (16) | 0.070 | 0.075 | PM 11/16 |
| CPI MoM (14) | 0.060 | 0.072 | PM 10/14 |
U-3 vs Bloomberg Consensus
Polymarket provides continuous 30-day forecasts (MAE improving 0.091% → 0.052%) versus Bloomberg's discontinuous coverage. An OLS of jobless-claims surprises vs next-day repricing gives R² = 0.52 — both coefficients carry the expected positive sign, but with only n=8 pairs this is suggestive, not conclusive.
Cross-event scorecard
| Dimension | FOMC | U-3 | CPI |
|---|---|---|---|
| MAE @ 1d | ~0.0005 | ~0.014 | ~0.053 |
| Brier | 0.044 | 0.096 | 0.107 |
| Benchmark | CME (daily) | BBG (gappy) | Investing |
Winner across all three dimensions: FOMC — the most liquid, best-calibrated macro market.
Corporate Earnings
Are decentralised markets informationally efficient for corporate earnings? Binary "beat/miss" contracts (tag 1013), Yes price = P(beat).
Brier 0.120
88% final accuracy
r ≈ 0.18 (weak return corr.)
382 scored events
Pipeline & data
DB export → analyst fetch via yfinance → comparison engine → evaluation. Coverage: 416 resolved / 209 unique markets, 382 scored events. Markets outperform both a random 50/50 and the historical beat-rate baseline.
NVIDIA Feb 2026 — worked example
| Stage | P(beat) |
|---|---|
| Listed (10 Feb) | ~0.47 |
| 7 days before | ~0.95 |
| Just before report | ~0.9995 |
| Outcome ($1.62 vs $1.52) | Beat ✓ |
IPO Timing
Markets: "IPOs before 2027?" (34 active) and "IPOs in 2025?" (25 resolved, all NO). Flagships: OpenAI, Anthropic, SpaceX, Cerebras. Raw 12.2M minute-level → 204,273 hourly.
Event-study: all significant @ 1%
Monotonic Brier decline
Option-like time decay
Finding 1 — rapid news incorporation
An event-study of cumulative abnormal probability change (CAPC) across IPO-relevant news — all significant at the 1% level.
| Event | Company | CAPC | t-stat |
|---|---|---|---|
| For-profit discussion | OpenAI | −1.0 | −123.2 |
| $4B funding round | Anthropic | 0.84 | 226.7 |
| Valuation > $350B | SpaceX | 0.66 | 70.0 |
| IPO pricing | Cerebras | 0.23 | 57.8 |
| Valuation update | Databricks | 0.58 | 225.6 |
Finding 2 — option-like time decay
A theta-gamma analogy: near-certain outcomes (SpaceX, Cerebras) stay stable while uncertain names (OpenAI, Anthropic) drift as expiry approaches — mirroring European digital options.
Finding 3 — progressive learning
Brier scores decline monotonically toward zero. The "all-NO" 2025 contract is a natural experiment: average Brier across all 25 companies improves systematically as expiration nears.
Markets rapidly price material news, exhibit option-like decay, and learn progressively toward resolution.
Fed / FOMC cross-market
High price alignment — mean absolute gaps rise from 1.39% (7d) to 2.97% (final). On paired Brier, Polymarket edges Kalshi at every horizon.
| Horizon | Abs Gap | PM Brier | Kalshi Brier |
|---|---|---|---|
| 7d | 1.39% | 0.155 | 0.156 |
| 1d | 1.82% | 0.091 | 0.098 |
| Final | 2.97% | 0.128 | 0.135 |
US CPI cross-market
Larger gaps (4.1%–6.7%) due to fragmentation and threshold transforms — yet Polymarket consistently posts a lower Brier across all horizons.
Earnings feasibility audit
Of 316 Kalshi rows, 299 are qualitative "earnings_call_mention" and only 17 are possible quantitative beats — so a direct earnings cross-market comparison is currently blocked by contract-design mismatch.
Key findings
- Prediction-market prices are highly informative versus baselines.
- Prices converge in high-liquidity macro markets → a shared information environment.
- Contract design is critical to feasibility of cross-market comparison.
Trading Signals & Cross-Platform Arbitrage
Translating efficiency observations into simulated, testable trading logic.
Internal signals
- Within-market trend: p(1h) − p(7d)
- Momentum: p(1h) − p(12h)
- Revision: |Δp| > 10pp
- Benchmark-deviation vs historical beat-rate
Cross-platform signals
- Disagreement/gap: |P(PM) − P(K)| > 10%
- Lead-lag: detect Δp > 5% in a short window
- Measure 1–6h reaction on the other venue
Cross-platform arbitrage
Buy the cheaper YES on one venue + the cheaper NO on the other; the pair always pays $1.
Arb_Cost = min(P_poly_yes, P_kalshi_yes) + 1 − max(P_poly_yes, P_kalshi_yes)
Net_Profit = 1 − fee − Arb_Cost · base fee 2% (sweep 2–4%)
Pair A — exactly-25bp July-2026 hike
Efficient market, no exploitable segmentation. Net profit −0.40% (daily). ADF confirms mean-reversion but an unfavourable mean.
| Fee | Net Profit | % pos days |
|---|---|---|
| 2.0% | −0.40% | 32.4% |
| 2.5% | −0.90% | 20.6% |
| 3.0% | −1.40% | 10.3% |
| 4.0% | −2.40% | 0.0% |
Pair B — any 2026 hike
A statistically & economically meaningful edge. Polymarket ~2.5pp cheaper; net profit +1.33% (daily), 61.9% positive days. Edge survives to ~3.3% fee; ADF mean-reverting with a positive mean → suitable for a limit-order grid.
| Fee | Net Profit | % pos days |
|---|---|---|
| 2.0% | +1.33% | 61.9% |
| 2.5% | +0.83% | 50.3% |
| 3.0% | +0.33% | 47.5% |
| 4.0% | −0.67% | 32.0% |
Arbitrage exists but is conditional on event horizon: the near-dated, finely-targeted Pair A integrates efficiently, while the longer-dated Pair B — with more distinct participant pools — sustains a persistent, mean-reverting edge (daily cumulative P&L ≈ +241%). Daily close data is treated as the primary evidence (≈70% of hourly Kalshi ticks are stale carry-forwards).
06 · Key Takeaways
The big picture
Bounded-price microstructure
The [0,1] constraint creates mechanical mean reversion — a feature, not a bug.
Continuous information aggregation
Prices refine continuously versus discrete expert surveys → a real temporal advantage.
Cross-event heterogeneity
Quality ranks FOMC > U-3 > CPI; liquidity & participant expertise matter.
Adequate calibration
Estimates stay directionally reliable and beat random guessing — a valuable real-time, crowd-sourced complement to expert forecasts.
07 · Future Work
Where the project is heading
Future directions
- Full lead-lag price-discovery analysis
- Expand to core CPI & corporate revenue-beat markets
- Refine automated contract transformation
- Real-time data streams & cross-venue arbitrage detection
- Align Kalshi bid-ask midpoints for apples-to-apples arbitrage
Known limitations
- Modest sample sizes (35 resolved macro events)
- Longer-horizon data sparsity
- Daily EOD prices miss intraday moves
- Kalshi hourly data ~70% stale carry-forward (daily treated as primary evidence)
08 · Team
The people behind the project
Chan Ngai Yeung
3036383484
Wong Suen Fung
3036381838
Ho Chun Hin
3036384000
The University of Hong Kong · Capstone Project 2025–2026